Hugo Braun · 15 October 2026
Quiet Waters as Classrooms: How UK Pond Stillness Data Shapes School Ecology Programs
Schools across the United Kingdom have begun incorporating datasets on pond water stillness into ecology lessons, and these records track surface movement, temperature layers, and sediment suspension over time. Data collection occurs through sensor networks maintained by environmental agencies, while participating institutions receive anonymized summaries that students process during classroom activities. Researchers at the Centre for Ecology & Hydrology have documented how stillness metrics correlate with dissolved oxygen levels, and this information feeds directly into lesson plans focused on aquatic ecosystems.
Data Collection Methods and Sources
Monitoring stations placed at pond sites record stillness through buoy-mounted accelerometers, and readings are taken at fifteen-minute intervals throughout the year. These devices capture wave amplitude and duration, then transmit figures to central databases where algorithms flag periods of extended calm. In October 2026 several regional education authorities expanded access to these feeds for secondary schools, allowing classes to compare local patterns against national averages. Students examine how reduced surface disturbance influences light penetration and plant growth rates, while teachers guide analysis using spreadsheets that align with national curriculum standards.
Integration into School Curricula
Ecology programs now include modules where pupils download stillness time series and overlay them with rainfall records from the Met Office. This approach connects water behavior to broader climate variables, and classes often map changes across multiple seasons to identify trends. One project in the Midlands required groups to calculate stillness duration percentages, then correlate those values with macroinvertebrate survey counts collected on-site. The resulting reports highlighted how calmer periods coincided with higher counts of certain species, and teachers used the exercise to demonstrate statistical relationships without relying on simulated examples.
Regional Program Examples
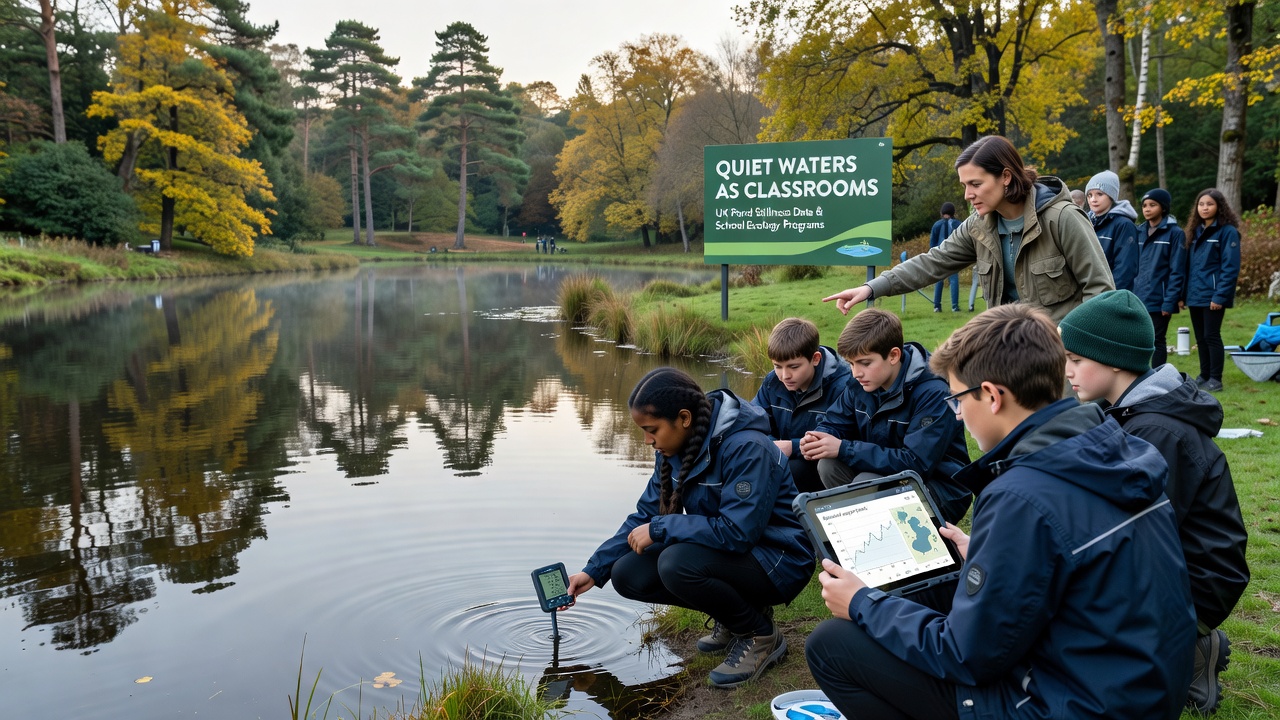
Programs in Scotland have paired stillness data with loch observations, whereas schools in East Anglia focus on smaller farm ponds that show quicker responses to wind shifts. In both cases, students visit sites equipped with portable probes that supplement fixed sensors, and they record additional variables such as turbidity and pH during field visits. Observers note that these combined datasets help illustrate spatial variability across the country, and curriculum developers adjust content each term based on the latest uploads. Figures released in late 2026 showed increased participation from primary-level groups as well, with simplified interfaces allowing younger pupils to interpret basic graphs of daily calm intervals.
Student Outcomes and Skill Development
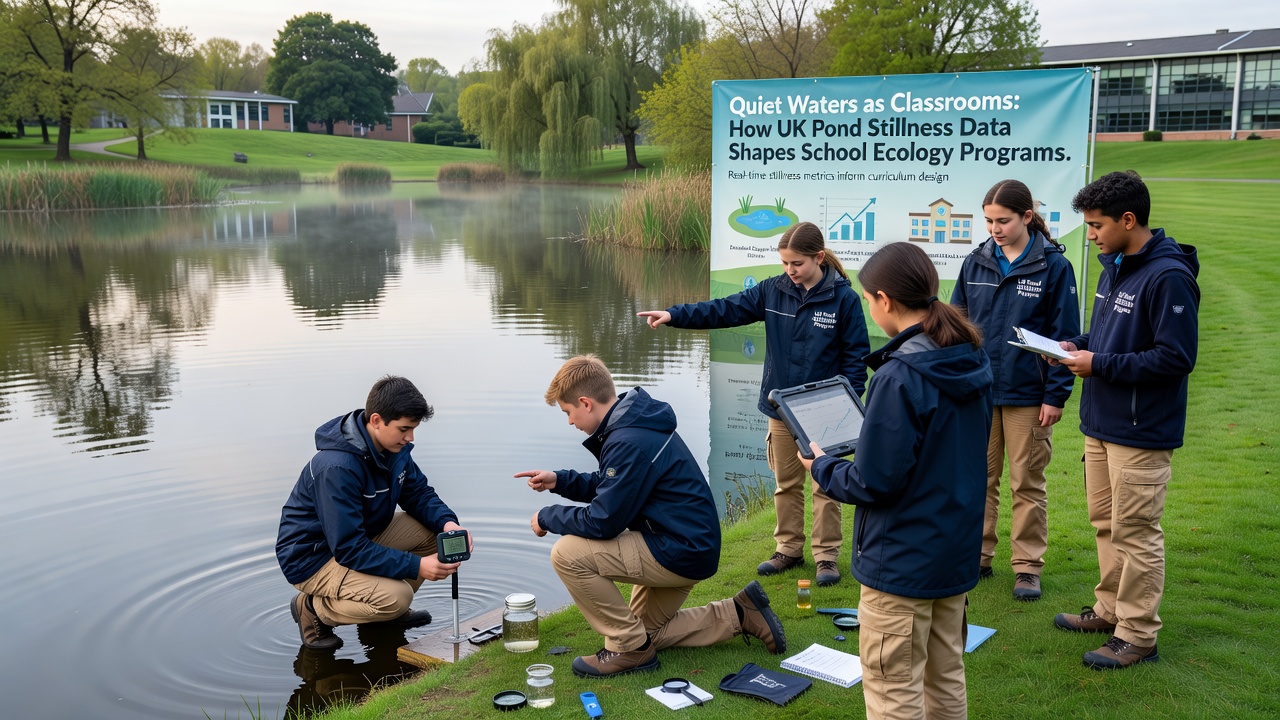
Participants gain experience handling real environmental measurements, and they practice quality control by cross-checking sensor outputs against manual observations. Schools report that these tasks build familiarity with data visualization tools, while also reinforcing concepts of experimental design. Data from participating institutions indicates that classes using stillness records produce more detailed hypotheses about habitat conditions than those relying solely on textbook examples. External partners, including local wildlife trusts, sometimes review student outputs and provide feedback that aligns with professional monitoring standards.
Technical Tools and Partnerships
Many programs utilize open-source platforms to visualize stillness trends, and developers have added features that allow direct import from government repositories. Partnerships with academic groups supply updated calibration protocols, ensuring measurements remain consistent across sites. According to Environment Agency guidelines, schools receive training on data interpretation before accessing live streams, and this step reduces errors in downstream analysis. Another collaboration with researchers at the European Environment Agency has introduced comparative datasets from continental sites, helping UK students place local findings within a wider European context.
Future Directions for Ecology Education
Education authorities plan to expand stillness monitoring into additional catchments, and new sensor deployments are scheduled for spring 2027. Curriculum updates will incorporate machine learning outputs that predict stillness based on weather forecasts, giving students exposure to emerging analytical techniques. These developments build on existing frameworks where real measurements replace hypothetical scenarios, and they maintain alignment with assessment criteria set by examination boards. Continued refinement of data delivery methods supports broader access while preserving the scientific integrity of the underlying records.
Conclusion
UK pond stillness data continues to serve as a practical resource for school ecology programs, supplying measurable variables that connect classroom concepts to field conditions. Through structured partnerships and standardized protocols, educators deliver lessons grounded in current observations, and students develop competencies in data handling that extend beyond single topics. Ongoing sensor expansions and cross-regional comparisons ensure the approach remains adaptable to new environmental records as they become available.