
Jonas Weber · 1 October 2026
Britain's New Tech Networks Map Shifts in Pond Stillness Patterns
Researchers have deployed interconnected sensor arrays across Britain to track variations in pond surface stillness, and these systems combine IoT devices with satellite data to produce detailed maps of how water surfaces respond to environmental factors. The networks record metrics such as surface ripple frequency, temperature gradients, and wind interaction patterns, while data collection occurs continuously at hundreds of sites from the Scottish Highlands to the wetlands of East Anglia. In October 2026 the networks received firmware updates that improved resolution for detecting micro-variations in stillness duration, allowing analysts to compare seasonal baselines against real-time readings.
How the Monitoring Systems Operate
Each monitoring station uses ultrasonic sensors and thermal cameras mounted on floating buoys that transmit readings every fifteen minutes to regional hubs, and these hubs aggregate information before forwarding it to a central database maintained by the UK Centre for Ecology and Hydrology. Algorithms process the incoming streams to distinguish between natural wave suppression caused by temperature inversions and external influences such as vegetation overgrowth or sediment changes. Observers note that the technology distinguishes stillness periods lasting longer than forty-five minutes from shorter intervals, creating time-series datasets that span multiple years. The European Environment Agency has referenced similar sensor frameworks in cross-border water quality reports, which helps place British findings within broader continental patterns.
Engineers designed the arrays to withstand seasonal flooding and ice formation, yet maintenance crews still conduct quarterly inspections to calibrate instruments and replace batteries. Data validation occurs through cross-checks against nearby weather stations operated by the Met Office, which confirms that stillness anomalies often align with documented shifts in regional humidity and air pressure. One installation near the Norfolk Broads demonstrated how overnight cooling can extend stillness windows by up to two hours compared with daytime measurements, and researchers have used this observation to refine predictive models for ecological surveys.
Regional Patterns Emerging from the Data
Analysis of the first full year of unified network output shows that ponds in upland areas of Wales exhibit longer average stillness intervals during autumn months than those recorded five years earlier, while lowland sites in the Midlands display more frequent interruptions linked to increased convective activity. Figures released by the British Geological Survey indicate that soil moisture levels around monitored ponds have declined by an average of twelve percent since 2021, correlating with measurable reductions in surface tension stability. The networks also capture how urban proximity affects stillness, because artificial light and heat from nearby infrastructure shorten calm periods by disrupting nocturnal temperature layering.
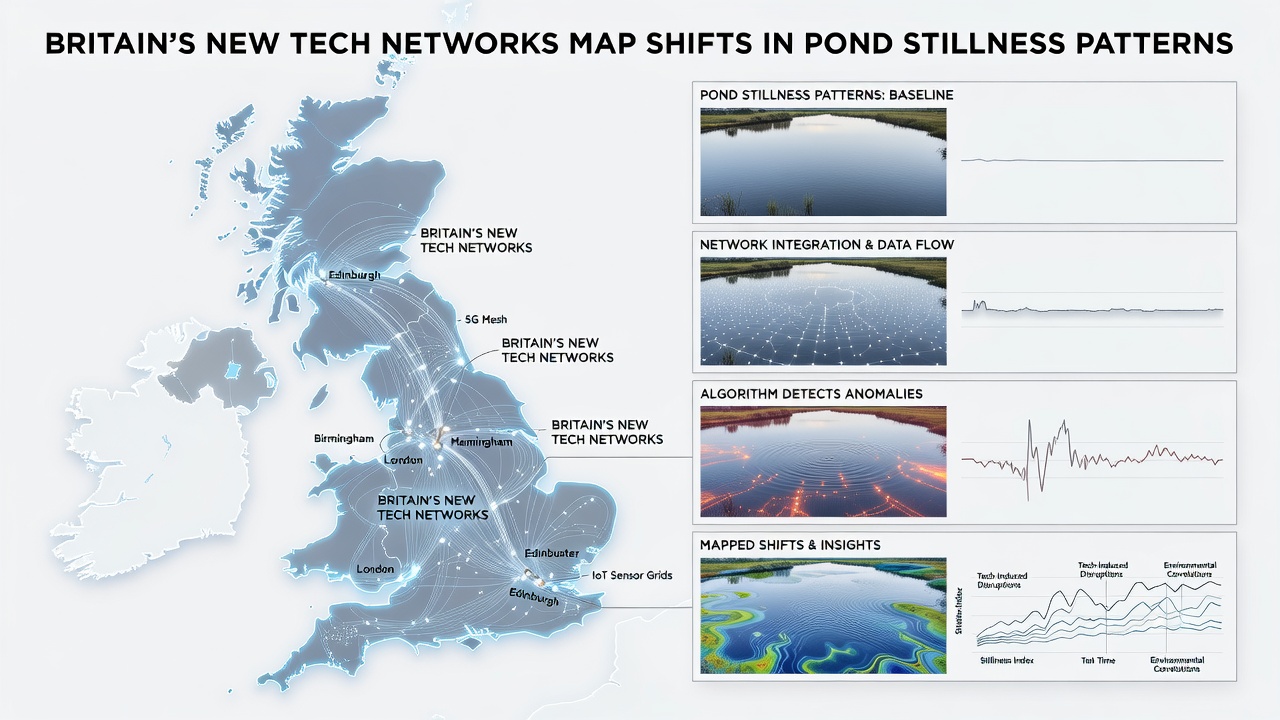
Case studies from the Lake District reveal that several tarns now experience stillness episodes interrupted every thirty minutes on average during summer, whereas comparable bodies of water in the 2018 baseline dataset maintained calm surfaces for nearly an hour. Researchers attribute part of the difference to changes in local wind regimes documented by the same sensor arrays, and they continue to investigate whether increased evapotranspiration from surrounding vegetation plays an additional role. The networks generate interactive maps updated weekly that colour-code stillness persistence, allowing land managers to identify sites where interventions such as selective reed cutting might restore longer calm intervals.
Integration with Broader Environmental Records
Scientists combine stillness data with records from the National River Flow Archive to examine how reduced flow in feeder streams influences pond surface behaviour, and preliminary comparisons suggest that catchments experiencing the greatest flow reductions also show the most pronounced increases in stillness variability. The Canadian Centre for Climate Services has published parallel work on boreal lake surfaces that uses analogous sensor methods, providing a reference point for interpreting British results within a global context. Network operators plan to expand coverage to an additional one hundred sites by the end of 2027, focusing on areas identified as data gaps in the current grid.
Public access portals allow registered users to download anonymised datasets for independent analysis, and several university teams have already incorporated the material into studies of amphibian breeding cycles and aquatic plant distribution. The systems record metadata on sensor uptime and calibration status alongside environmental variables, which ensures transparency when external groups review the findings. Government agencies responsible for habitat monitoring have begun incorporating stillness maps into routine reporting requirements for protected wetland sites.
Conclusion
The expansion of Britain's tech networks for pond stillness mapping continues to generate granular datasets that link surface conditions with wider climatic and hydrological variables. Ongoing refinements to sensor placement and data processing pipelines support increasingly precise comparisons across regions and seasons. As coverage grows, the accumulated records will provide a factual basis for tracking long-term environmental changes without relying on anecdotal observation alone.